> ## Documentation Index
> Fetch the complete documentation index at: https://help.lobstr.io/llms.txt
> Use this file to discover all available pages before exploring further.
# How we measure scraper status and uptime
> How lobstr.io calculates the live reliability shown on every scraper's store page — hourly canary runs, the daily color tiers, the 90-day uptime score, and the paused state.
Every scraper on the [lobstr.io store](https://www.lobstr.io/store) shows a live reliability block: a big uptime percentage, a 90-day timeline with one colored bar per day, and a short status line. It's the panel that says **"Built to run."**
This page explains exactly how that number is measured — because a reliability claim is only worth something if you can see how it's calculated.
The block sits on every scraper's store page (look for the **`#status`** anchor, e.g. `lobstr.io/store/google-maps-leads-scraper#status`). The **How we measure →** link under it brings you here.
## What the block shows
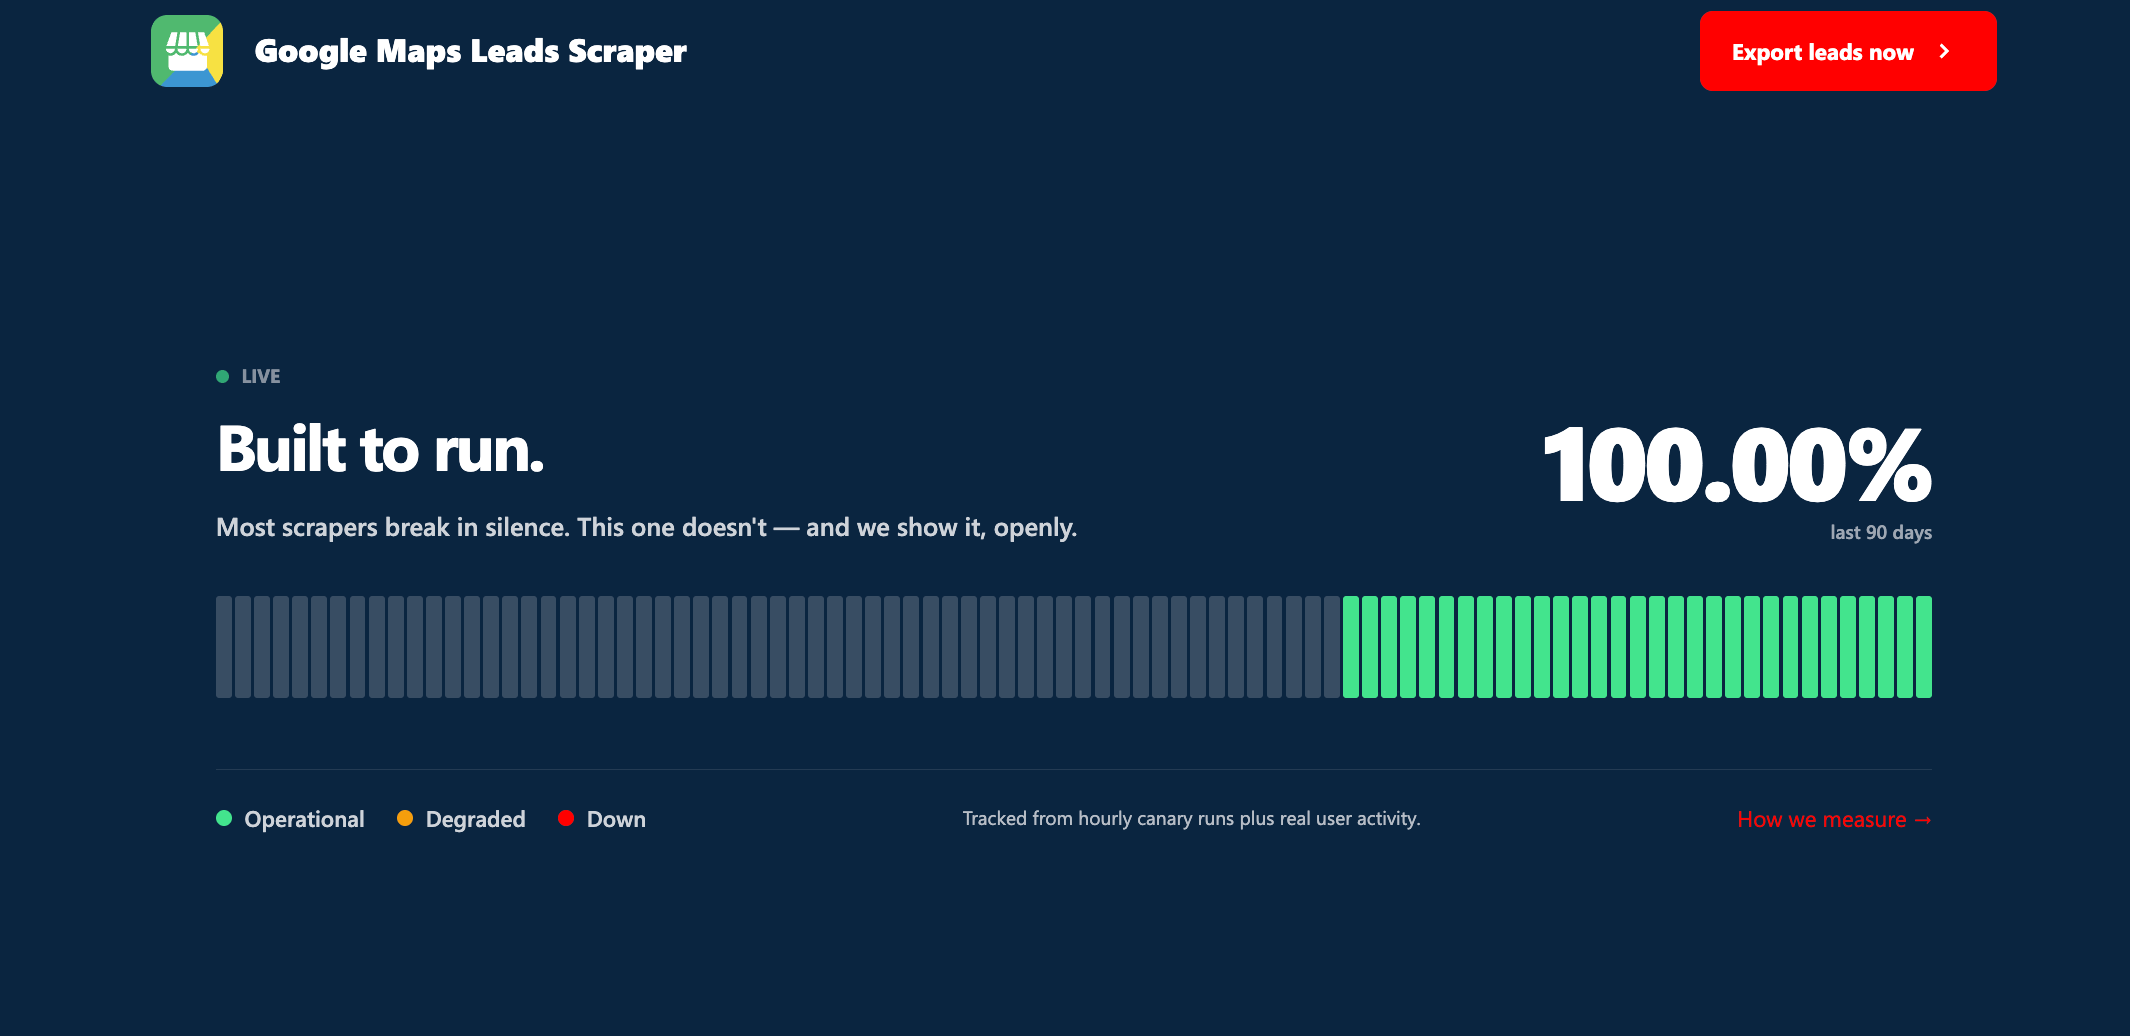 | Element | What it is |
| ------------------- | --------------------------------------------------------------- |
| **Big percentage** | The scraper's overall success rate across the **last 90 days**. |
| **90-day timeline** | One bar per day, color-coded by that day's health. |
| **Legend** | Operational, Degraded, Down — the three live states. |
| **Status line** | "Tracked from hourly canary runs plus real user activity." |
When a scraper is healthy, the block reads **Built to run.** with a pulsing **Live** dot. The headline number is the one to trust — it's computed from every real run, not a marketing figure.
## Where the data comes from
Two sources feed the score, pooled together for each day:
1. **Hourly canary runs.** lobstr.io runs every public scraper on a fixed hourly schedule against the **live source**, around the clock — roughly 24 checks a day. This is the heartbeat that proves the scraper still works even when no customer is using it that hour.
2. **Real user activity.** Every finished run of that scraper by real customers also counts toward the day's numbers.
Because the canary hits the *actual* website hour after hour, the score reflects the scraper genuinely working in production — not a cached or synthetic metric.
## When a run counts as successful
A run counts as successful unless **the scraper itself errored**. That's the only thing held against a scraper's uptime.
Crucially, these do **not** count as failures, because they aren't the tool breaking:
* a run **you aborted** on purpose,
* a run that **paused** because a synced account needed re-syncing, hit a platform limit, or ran out of credits,
* a run stopped for a **plan or billing** reason.
Only a genuine technical error (run status `Error`) lowers the score. For the full list of reasons a run can stop — and which are errors versus normal stops — see [Run stop reasons](/core-concepts/run-stop-reasons).
This is deliberate. If aborting your own run or letting an account expire dinged the scraper's score, the number would measure *your* usage, not the scraper's reliability. We only count the scraper breaking.
## What each color means
Each day's bar is colored by the share of that day's runs that succeeded:
| Color | Status | Threshold |
| ------ | --------------- | --------------------------------------- |
| Green | **Operational** | 90% or more of the day's runs succeeded |
| Orange | **Degraded** | 50% to 89% succeeded |
| Red | **Down** | fewer than 50% succeeded |
| Gray | **No data** | no runs that day (scraper inactive) |
Hover any bar to see the exact figure for that day — `X% runs successful` and the date.
## The 90-day score
The big percentage is simply:
```
total successful runs ÷ total runs, over the last 90 days
```
It's a single number across the whole window, refreshed continuously — the page re-aggregates the scraper's recent runs each time it loads, on top of a daily roll-up, so it's always current.
A scraper that was added recently may show **fewer than 90 days** of history at first. The window fills in over time as daily reliability is recorded.
## When a scraper is paused
If a scraper hits a technical issue we can't fix on the spot, we take it **offline** rather than let it return broken or partial data. The block then changes:
* the title becomes **Temporarily paused.**
* the percentage becomes a grayed-out **—**
* the bars are ghosted, and the legend shows a single **Paused** state
We don't run the hourly canary while a scraper is paused — that's why there's no data to show for that stretch. It comes back online once it's fixed.
We pause scrapers that don't meet our reliability bar on purpose. We don't ship broken tools.
## Still have questions?
If a scraper's status looks wrong, or you want detail on a specific run, ping us on [Crisp chat](https://go.crisp.chat/chat/embed/?website_id=45b5fabf-a2d0-441c-b3de-2d517bdeeac9) or email `contact@lobstr.io`.
| Element | What it is |
| ------------------- | --------------------------------------------------------------- |
| **Big percentage** | The scraper's overall success rate across the **last 90 days**. |
| **90-day timeline** | One bar per day, color-coded by that day's health. |
| **Legend** | Operational, Degraded, Down — the three live states. |
| **Status line** | "Tracked from hourly canary runs plus real user activity." |
When a scraper is healthy, the block reads **Built to run.** with a pulsing **Live** dot. The headline number is the one to trust — it's computed from every real run, not a marketing figure.
## Where the data comes from
Two sources feed the score, pooled together for each day:
1. **Hourly canary runs.** lobstr.io runs every public scraper on a fixed hourly schedule against the **live source**, around the clock — roughly 24 checks a day. This is the heartbeat that proves the scraper still works even when no customer is using it that hour.
2. **Real user activity.** Every finished run of that scraper by real customers also counts toward the day's numbers.
Because the canary hits the *actual* website hour after hour, the score reflects the scraper genuinely working in production — not a cached or synthetic metric.
## When a run counts as successful
A run counts as successful unless **the scraper itself errored**. That's the only thing held against a scraper's uptime.
Crucially, these do **not** count as failures, because they aren't the tool breaking:
* a run **you aborted** on purpose,
* a run that **paused** because a synced account needed re-syncing, hit a platform limit, or ran out of credits,
* a run stopped for a **plan or billing** reason.
Only a genuine technical error (run status `Error`) lowers the score. For the full list of reasons a run can stop — and which are errors versus normal stops — see [Run stop reasons](/core-concepts/run-stop-reasons).
This is deliberate. If aborting your own run or letting an account expire dinged the scraper's score, the number would measure *your* usage, not the scraper's reliability. We only count the scraper breaking.
## What each color means
Each day's bar is colored by the share of that day's runs that succeeded:
| Color | Status | Threshold |
| ------ | --------------- | --------------------------------------- |
| Green | **Operational** | 90% or more of the day's runs succeeded |
| Orange | **Degraded** | 50% to 89% succeeded |
| Red | **Down** | fewer than 50% succeeded |
| Gray | **No data** | no runs that day (scraper inactive) |
Hover any bar to see the exact figure for that day — `X% runs successful` and the date.
## The 90-day score
The big percentage is simply:
```
total successful runs ÷ total runs, over the last 90 days
```
It's a single number across the whole window, refreshed continuously — the page re-aggregates the scraper's recent runs each time it loads, on top of a daily roll-up, so it's always current.
A scraper that was added recently may show **fewer than 90 days** of history at first. The window fills in over time as daily reliability is recorded.
## When a scraper is paused
If a scraper hits a technical issue we can't fix on the spot, we take it **offline** rather than let it return broken or partial data. The block then changes:
* the title becomes **Temporarily paused.**
* the percentage becomes a grayed-out **—**
* the bars are ghosted, and the legend shows a single **Paused** state
We don't run the hourly canary while a scraper is paused — that's why there's no data to show for that stretch. It comes back online once it's fixed.
We pause scrapers that don't meet our reliability bar on purpose. We don't ship broken tools.
## Still have questions?
If a scraper's status looks wrong, or you want detail on a specific run, ping us on [Crisp chat](https://go.crisp.chat/chat/embed/?website_id=45b5fabf-a2d0-441c-b3de-2d517bdeeac9) or email `contact@lobstr.io`.